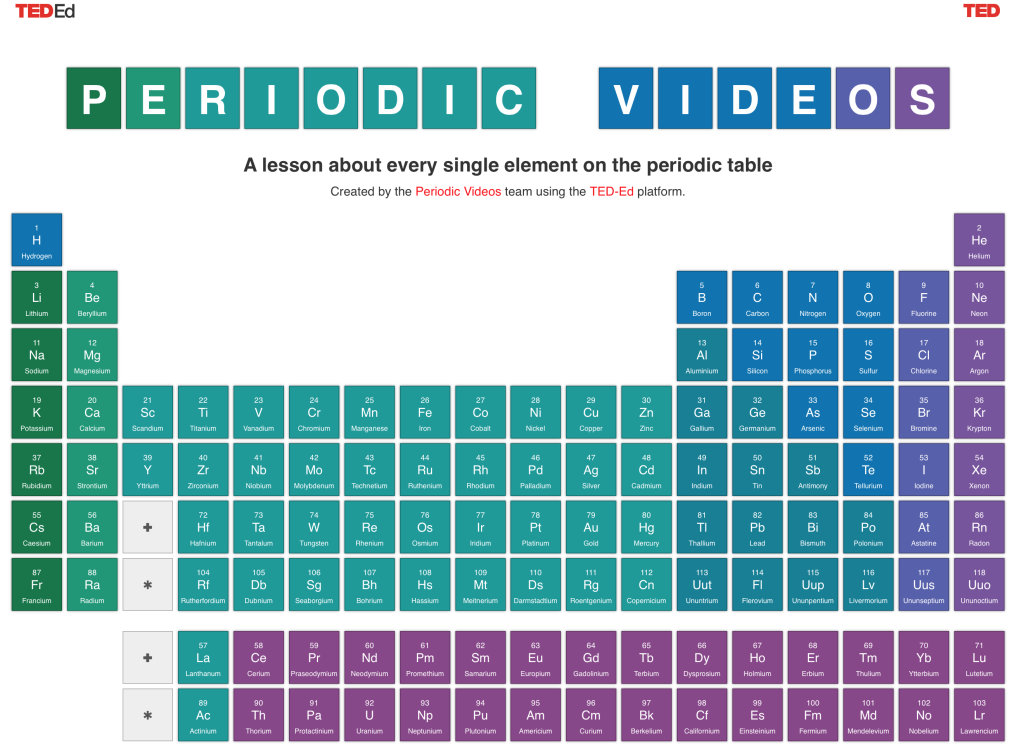
The periodic table is the most important reference document in chemistry. It arranges all the known elements from left to right and top to bottom in order of increasing atomic number (number of protons in the nucleus), electron configurations and recurring chemical properties. Elements are presented in order of increasing atomic number, which is typically listed with the chemical symbol in each box.
The different rows of elements are called periods. The period number of an element signifies the highest energy level an electron in that element occupies (in the unexcited state). The number of electrons in a period increases as one traverses down the periodic table; therefore, as the energy level of the atom increases, the number of energy sub-levels per energy level increases.
Using the data in the table scientists, students, and others that are familiar with the periodic table can extract information concerning individual elements. For instance, a scientist can use carbon’s atomic mass to determine how many carbon atoms there are in a 1 kilogram block of carbon.
People also gain information from the periodic table by looking at how it is put together. By examining an element’s position on the periodic table, one can infer the electron configuration. Elements that lie in the same column on the periodic table (called a “group”) have identical valance electron configurations and consequently behave in a similar fashion chemically. For instance, all the group 18 elements are inert gases. The periodic table contains an enormous amount of important information. People familiar with how the table is put together can quickly determine a significant amount of information about an element. As a result, a periodic table provides a useful framework for analyzing chemical behavior, and so the tables, in various forms, are widely used in chemistry and other sciences.
While the Periodic Table might is easy to grasp for many science needs, it comes across as excruciatingly complicated to the average person. TED-Ed, a branch of the globally known TED conferences, has introduced a great tool to better help us understand this complex concept. The organization draws on TED-Ed’s library of lessons to make available curated educational videos–in this case, on the Periodic Table, created by Periodic Videos at the University of Nottingham in the UK.
Here is the link to the TED-ED/Periodic Videos grid:


I recommend: https://play.google.com/store/apps/details?id=pl.artmetic.tablica_mendlejewa